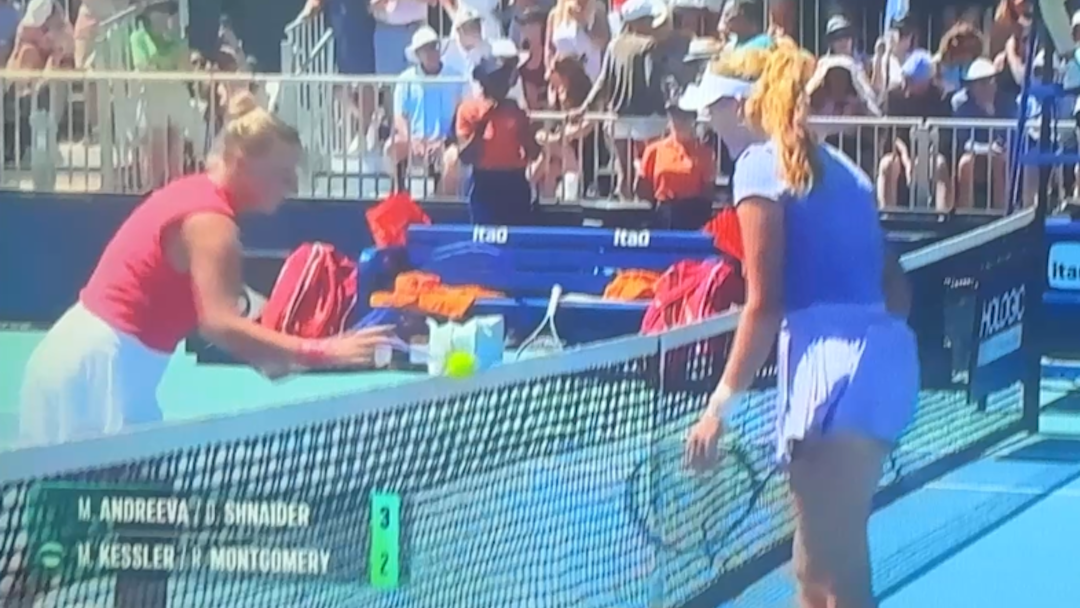
During the fourth round of the 2021 US Open between Bianca Andreescu and Maria Sakkari, one of the player’s coaches was observed to be charting the match. It is the first time in my recent memory when that activity was highlighted during a broadcast. It probably occurs more frequently than the television commentators notice and mention. More notably, he was using old school paper and pen, which is a throwback to an earlier era.
There is no “one way” to chart a match. On a basic level, charting is simply the collection of data and information that allows a player or a coach to objectively quantify what occurred during a match. Typical things to chart are unforced errors, serving percentages, shot location, and point length. I have even seen a parent score body language following each point.
When the “Umpire I Gave Birth To” was still playing junior tennis, I charted her matches on a semi-regular basis. She was always skeptical of my antiquated ideas on tennis tactics and strategy, such as the importance of keeping the ball in play. It was good to have data to back up my observations. She didn’t always buy into the feedback, but my self-righteous indignation was statistically well supported.
Sometimes the information from my daughter’s charted matches led to very standard drills and practice. At one point, the data clearly showed that she had a significantly higher chance of winning points that extended past her second stroke in each point. In other words, stabilizing into a rally after the first few strokes. As a result, we did drills that focused on serves and returns “plus one” point patterns. Probably we didn’t need data to show the importance of being able to keep the ball in play in the early stages of each point.
A very counter-intuitive insight emerged from matches charted at one particular tournament. My daughter went through a phase of winning a significantly higher percentage of points on her second serve than when she put a first serve in play. That paradox was confounded by the “eye test” because at the time her first serve was an absolute cannon ball while her second was a lollipop. Casual observation alone was unlikely to detect an issue with the first serve, but the stats don’t lie.
Once the data from her charted matches revealed what was happening, it was obvious that we needed to find the root cause of losing so many points off what appeared to be excellent serves. The issue turned out to be poor recovery footwork exacerbated by the fact that her first serve had so much velocity that returns came back fast. Put simply, she was out-serving her footwork. The remedy was more serve plus one drills specifically designed to take time away from her on the return.
In “The USTA Player Development Analytics Team” I wrote about the services that are provided to the top professional American players by the USTA. It includes data to guide a player’s own development as well information useful for developing tactics and strategies for upcoming opponents. I am sure that they use some modern version of match charting as a part of those analytics.
Match charting is a sidebar detail associated of the story of when my (almost) 17 year old self decided to give up tennis for good. I have never actually shared that full story and that isn’t going to change today. Charting was simply the way I passed the time on that occasion.
Back in the 1980s, video equipment was expensive, bulky, and required a lot of power. Consequently, charting was the only way to capture what was occurring in most matches. Nowadays a parent or coach would simply whip out a phone to capture a video clip or hang an action camera on the fence. I still think there is still value in the chart and data collected over a full match.
Players at all levels can benefit from the insight revealed in charted data.


